
Introduction
Argonne National Laboratory (Argonne) proposes a Resilient Infrastructure Initiative to leverage basic and applied science and technology to develop next-generation infrastructure risk assessment models.[1] One of the primary goals of the Resilient Infrastructure Initiative is to develop an infrastructure impact analysis tool that integrates and automates the interactions of existing system modeling tools for anticipating cascading and escalating failures. This paper presents an overview of the work conducted for the integration of two energy system models and the application of the integrated approach to two case studies.
Building upon Proven Methods and Models
The first phase of development focused on the integration of two threat-agnostic electric power and natural gas models: EPfast and NGfast. Both tools have been subjected to extensive validation procedures. In particular, numerous applications using EPfast for U.S. Department of Homeland Security (DHS)-related activities have enabled interactions with regional utilities to review and comment on modeling results. Their reviews and comments have been favorable and encouraging.
EPfast is an electric power outage area estimation tool for simulating the behavior of large power systems following power disruptions caused by the loss of power system components.[2] The model explores the possibility of uncontrolled islanding caused by cascading failures and estimates the extent (geographic size) and depth (amount load shed) of the power outage.
NGfast uses progressive forward pipeline ownership identification and flow quantification processes to track lost flow volumes caused by a pipeline break or curtailment in natural gas supply. Impacts are measured in terms of extent of gas volume disrupted, States affected, utilities affected, number and type of customers affected, and amount of natural-gas-based capacity affected.[3]
EPfast and NGfast were originally designed to operate independently. No consideration was given to integrating them as one composite model representing the interdependencies between the electric power and natural gas systems. However, increased reliance on natural gas as a preferred fuel for electric power generation has continued and was further emphasized during training and interaction opportunities with the Midcontinent Independent System Operator (MISO) during 2015.[4] Therefore, the motivation for an approach to integrate the two models was highly supported. Such an approach first required the development of a generalized framework to facilitate the exchange of output and input files among models with different granularity and network topology. The interactivity between models was implemented by modifying their input and output files, so that they were appropriately processed and transformed into prescribed formats compatible with the receiving model that is next in the simulation sequence.
Generalized Framework for Combining Models
The generalized framework facilitated the integration of multiple disparate models into one “virtual” model without introducing major modifications to the original stand-alone models. The integration was done with Data Centric Modeling/Simulation (DCMS), a platform-independent, device-independent paradigm-shifting framework for orchestrating model interactions. DCMS purposefully keeps current models intact, with little to no code changes, while facilitating a functional connection to other models. This framework allows for an expansive array of new model development by combining other models that were previously difficult for developers to integrate. The initial conditions from the automated failure analysis define the inputs into the updated and integrated versions of EPfast and NGfast.
The Integrated Electric Power-Natural Gas (EP-NG) Model
The integrated EP-NG model is composed of four main modules (Figure 1).
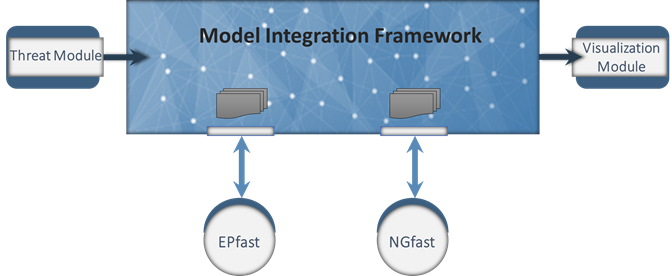
The Threat Module gives users the opportunity to define a threat or hazard scenario of his/her choice (e.g., hurricane, flood, and human threat). This module combines two models:
- The Disaster Model, which automatically mines data from web-based sources and then projects the impact zone given the postulated scenario.
- The Damage Model, which uses fragility curves and impact zones to produce a list of infrastructure assets that could be affected given the postulated scenario.
The EPfast and NGfast modules are run in an iterative process until model results converge. The iterative process captures the inherent interdependencies between the electric power and natural gas infrastructure, in which outages in electric power assets may result in outages in natural gas assets and vice versa. Figure 2 presents potential interdependencies between the electric power and natural gas infrastructure that were integrated in the combined EP-NG Model.

The iterative process coupling model interactions consists of four primary steps:
- Step 1 – Assuming the initial infrastructure impacted by the scenario is the electric system, EPfast is launched automatically, determines the impact on the grid, and generates electric power outage areas.
- Step 2 – All electric-dependent assets in the gas system that are affected by the power outage are identified. All natural gas assets within a power outage area experiencing more than a 30% load curtailment are de-energized and removed from service.
- Step 3 – The input file for NGfast is modified to reflect the de-energization of all natural gas assets affected by the power outage. The modified input file is then used by NGfast to determine the natural gas supply shortfall resulting from the incapacitated natural gas assets.
- Step 4 – NGfast generates a list of natural-gas-fired power plants that are at risk of losing their fuel supply, and thus are in danger of being de-energized and removed from service. The disruption of these electric power assets defines the operational conditions for the next iteration of the integrated model.
Steps 1 through 4 are repeated until a final, stable operating condition is found that does not result in additional cascading effects.
The last component of Figure 1 is the Visualization Module. It uses the final results from the iterative EPfast and NGfast process to generate a geographic information system map showing the combined consequences of the natural gas and electric power outages, including their resulting outage area islands and attributes. Examples of Visualization Module products are found in the case studies described below.
Case Studies
Two case studies, Florida and North Dakota, demonstrate the logic of propagating disruptions between the natural gas and electric power infrastructure and were used to validate the integrated EP-NG Model.
Florida
Florida represents the simplest of the EP-NG interactions because it is a terminal State. As such, there is no complex downstream system to consider that could further propagate the disruption. Furthermore, the natural gas system is simple—only two major high-pressure transmission pipelines serve the State.
The scenario postulates the occurrence of a guillotine (i.e., complete) break on a major interstate transmission pipeline supplying natural gas to the State, resulting in a 100% reduction in the flow of gas through the pipeline. The pipeline break also disrupts the fuel delivery to a large number of gas-fired power plants in the State. These power plants would cease operation, leading to a Statewide blackout with varying load curtailment intensity ranging from 10% to 100%.
Florida has three small natural gas processing plants (NGPPs) located in an area that would experience a 40% percent load curtailment. As such, the NGPPs are assumed to be de-energized. However, since the combined output from these NGPPs is small relative to the total load, the associated gas curtailment would have no notable impact on the gas customers in Florida. The iterative simulation between NGfast and EPfast stops at this point since the magnitude of the cascading impact is deemed no longer worth pursuing. Figure 3 shows the results of the simulation for the Florida case study.

Figure 3 – Florida Case Study[6]
North Dakota
Characterizing and estimating the natural gas and electric power interdependencies within North Dakota is more complex. Unlike Florida, which is a terminal State, North Dakota is an originating State, whereby pipelines traversing the State deliver natural gas to several downstream States as far away as Illinois. Furthermore, North Dakota includes a number of major production fields, where oil and natural gas are produced, indicating a large number of essential NGPPs. NGPPs are critical to the natural gas supply, because unprocessed natural gas contains corrosive impurities that would contaminate and corrode natural gas pipelines and compressors and damage customer equipment.[5]
The North Dakota scenario postulates the occurrence of a cyberattack on the North Dakota grid involving six major substations in Western North Dakota in an area close to where the NGPPs are located. The cyberattack causes an extended power outage over a broad geographic region that encompasses all 16 NGPPs within the State. Figure 4 shows the results of the simulation for the North Dakota case study indicating a 28% reduction in the natural gas supply to the southeast.
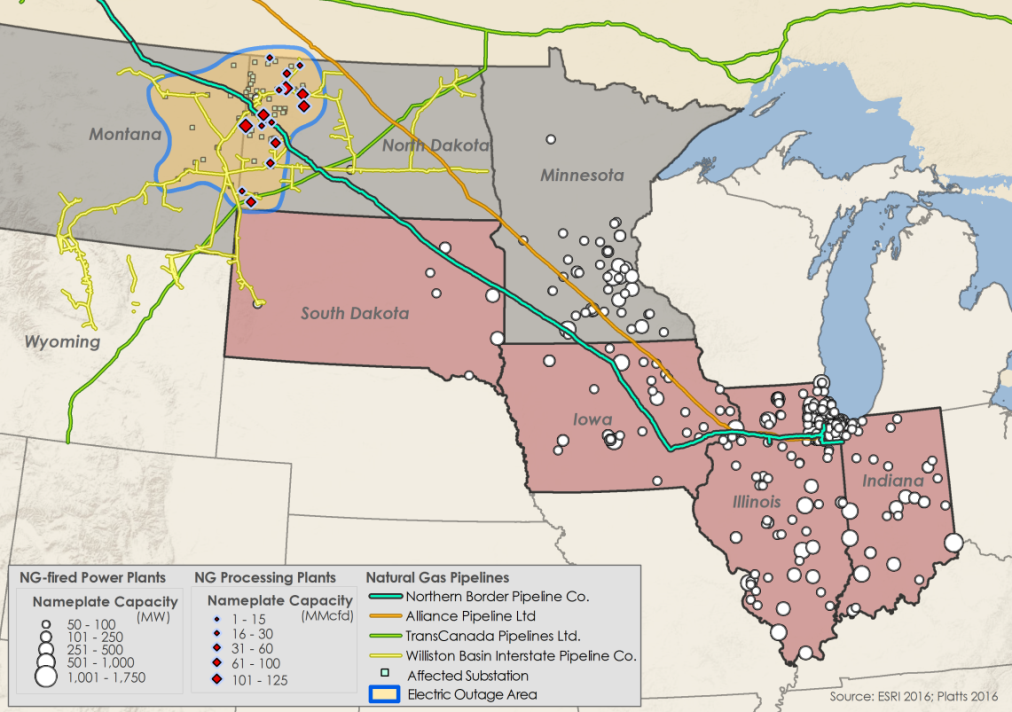
Figure 4 – North Dakota Case Study[7]
Future Work
Future work includes constructing additional case studies of the integrated EP-NG Model that go beyond the Florida and North Dakota regions and represent a larger geographic scope like the MISO or our National energy infrastructure. Expanding data sets that relate electric substations to natural-gas-fired power plants and NGPPs is an essential part of this process. Further expansion of the database relating natural gas pipeline companies with natural-gas-fired power plants and NGPPs is also needed to characterize the natural gas infrastructure covering broad regions of the country. Selecting a larger region like MISO as a next case study would advantageously leverage previous studies and collaboration with MISO staff that could lead to substantial model validation opportunities.
Currently, the Threat Module only includes hurricane, flood, and human threat, which restricts its usefulness. Future versions will consider other natural, manmade, and accidental events, including earthquake, temperature rise, improvised explosive devices, or winter storms. Related to this effort, the methods will also require considering regional resilience measures (i.e., preparedness, mitigation, response, and recovery) to simulate the behavior of critical infrastructure systems when an event occurs. Similarly, it is intended that the Model Integration Framework be applied to the integration of other lifeline infrastructure models such as telecommunications, oil, and water.
Conclusion
Research efforts under the Resilient Infrastructure Initiative at Argonne have recognized the increased usefulness of integrated models, such as the combined electric-gas models, in aiding the design of resilient energy systems and model infrastructure interdependencies. The EP-NG Model uses a generalized integration framework that accommodates disparate models and facilitates their seamless interaction during simulation. The model was applied to the States of Florida and North Dakota. Using the Model Integration Framework and an expanded version of the Threat Module will allow easy integration of other infrastructure models and promote an all-hazards resilience approach.
Acknowledgments
The work presented in this paper was partially supported by Argonne National Laboratory under U.S. Department of Energy contract number DE-AC02-06CH11357. The submitted manuscript has been created by UChicago Argonne, LLC, Operator of Argonne National Laboratory (“Argonne”). Argonne, a U.S. Department of Energy Office of Science laboratory, is operated under Contract No. DE-AC02-06CH11357. The U.S. Government retains for itself, and others acting on its behalf, a paid-up nonexclusive, irrevocable worldwide license in said article to reproduce, prepare derivative works, distribute copies to the public, and perform publicly and display publicly, by or on behalf of the Government.
If you would like more information regarding this paper, please contact Stephen Folga at [email protected].
References
[1] Megan Clifford, “National Call to Action: The Resilient Infrastructure Initiative,” Center for Infrastructure Protection and Homeland Security, Dec. 2, 2015, https://cip.gmu.edu/2015/12/02/national-call-to-action-the-resilient-infrastructure-initiative/.
[2] Edgar C. Portante, Brian A. Craig, Leah Talaber Malone, James Kavicky, Stephen F. Folga, and Stewart Cedres, “EPFast: A Model for Simulating Uncontrolled Islanding in Large Power Systems,” IEEE.org 1758-69 (S. Jain, R.R. Creasey, J. Himmelspach, K.P. White, and M. Fu, eds. 2011), http://ieeexplore.ieee.org/stamp/stamp.jsp?arnumber=06147891 (presented at the 2011 Winter Simulation Conference).
[3] Edgar C. Portante, Brian A. Craig, Stephen M. Folga, “NGfast: A Simulation Model for Rapid Assessment of Impacts of Natural Gas Pipeline Breaks and Flow Reductions at U.S. State Borders and Import Points,” IEEE.org 1118-26 (S.G. Henderson, B. Biller, M.-H. Hsieh, J. Shortle, J.D. Tew, and R.R. Barton, eds. 2007), http://ieeexplore.ieee.org/stamp/stamp.jsp?tp=&arnumber=4419711 (presented at the 2007 Winter Simulation Conference).
[4] Argonne National Laboratory, Phase 1 of the National Electric Grid Resiliency Framework Initiative, report to U.S. Department of Energy, Office of Electricity Delivery and Energy Reliability (DOE/OE) (Nov. 15, 2015).
[5] “Natural Gas Processing: The Crucial Link Between Natural Gas Production and Its Transportation to Market,” Energy Information Administration 1 (Jan. 2006), http://www.eia.gov/pub/oi_gas/natural_gas/feature_articles/2006/ ngprocess.pdf.
[6] Generated using tools from ESRI and Platts. “ArcGIS Desktop: Release 10.3,” Environmental Systems Research Institute, accessed May 31, 2016, http://esri.com/; “GIS Data: Electric and Natural Gas,” S&P Global Platts, accessed May 31, 2016, http://www.platts.com/products-services.
[7] Ibid.