Transportation Role in Community and Societal Resilience
A disruption in one or more of the modes of transportation is bound to send ripple effects in a number if not all of the infrastructure sectors due to the significant inter-dependencies between critical infrastructure and lifeline systems and the multi-dimensional impact of the transportation sector on the economy. Depending on the nature and magnitude of the disruption, the potential impact on system performance can range from a reduction in throughput to a total system shut-down in the directly impacted system and parts of its inter-related other modes of transportation and infrastructure sectors.
Moreover, a major event such as Superstorm Sandy can have a widespread effect on community resilience, in large part due to disruptions to its transportation network. When streets were flooded with six feet of standing water in some of the low-lying areas of New Jersey, residents were unable to move to their workplaces or get fresh food supplies for a number of days after the storm receded, resulting in significant productivity reductions.[1]
Overarching Policy Direction
Bob Kolaski’s review of Executive Order (EO) 13636 on Improving Critical Infrastructure Cybersecurity and Presidential Policy Directive (PPD) 21 on Critical Infrastructure Security and Resilience underscored “the need to augment our existing focus on managing critical infrastructure risk through physical protective measures with additional emphasis on strengthening security and resilience across interrelated systems.”[2] He noted that a secure and resilient Nation should also maintain capabilities across the whole community to prevent, mitigate, respond to, and recover from the threats and hazards that pose the greatest risk.
Understanding Performance, Resilience and Sustainability
As noted by Ayyub resilience as an absolute measure is represented by an aggregate over time of the actual performance level relative to its desired or normal service level.[3] To that end, it can be considered a composite of many constructs, such as Robustness (percent conservation of performance in the immediate aftermath of the event), Redundancy (availability of backup resources or routes), Resourcefulness (ability to mitigate and innovate to dampen magnitude and duration of impact), and Rapidity (average recovery rate per time unit). While each of these entities contributes to the overall estimation of system resilience relative to a localized or widespread event, the actual definition of the proper performance metrics is an essential first step in a comprehensive resilience analysis.
The complementary yet different societal goals of resilience and sustainability are often mentioned inter-changeably. The main distinction is that resilience is tied to short-term sometimes extreme events, and sustainability refers to “development that meets the needs of the present without compromising the ability of future generations to meet their future needs.”[4] The linkage between resiliency and sustainability for a given infrastructure system is established through the definition of a life-cycle aggregate impact of all short-term and long-term events, as the sum of the expected values of performance impacts from such events. This holistic performance measure which integrates all short-term and long-term events using a risk formulation, as a summed product of likelihood and outcome, is a good attempt at formulating an all-hazards life-cycle economic metric for system performance.
Transportation Performance and Resilience Metrics
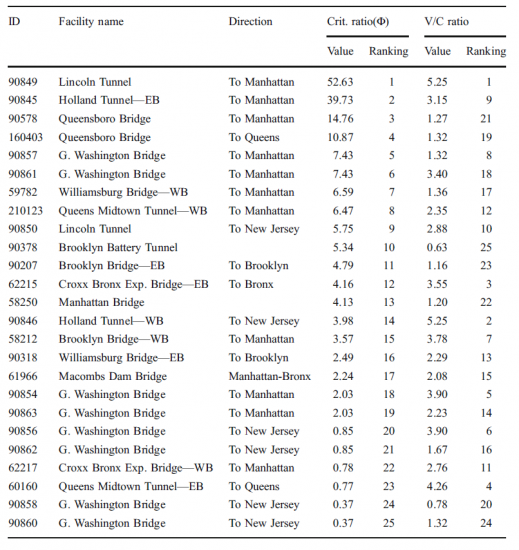
Transportation models have been developed to help prioritize asset hardening strategies in a network of interconnected highways. Satish Ukkusuri presented metrics related to costs associated with disruptions in key nodes or links in the network, using individual travel time as a determinant of cost (Figure 1).[5] The first metric is a criticality ratio that estimates the change in system performance before the disruption (baseline) in a given node or facility and after the disruption as a percent of the baseline system performance. Facilities can then be ranked based on the most “critical” nodes. Another metric (V/C ratio) tracks the ratio of the composite vehicle hours after the disruption to the total vehicle hours before the disruption. Rankings of various facilities in the Greater New York City metropolitan area according to both metrics are shown in Figure 1. Such metrics can be useful to prioritize assets based on system resilience as a result of an event that would disrupt an asset at a time, and is a starting point for a more comprehensive multi-hazard analysis of system performance.

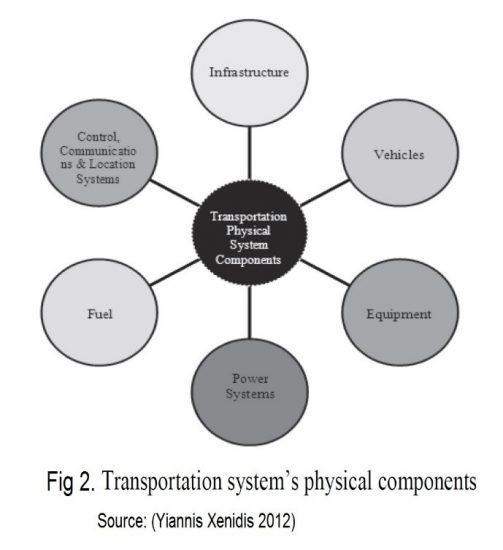
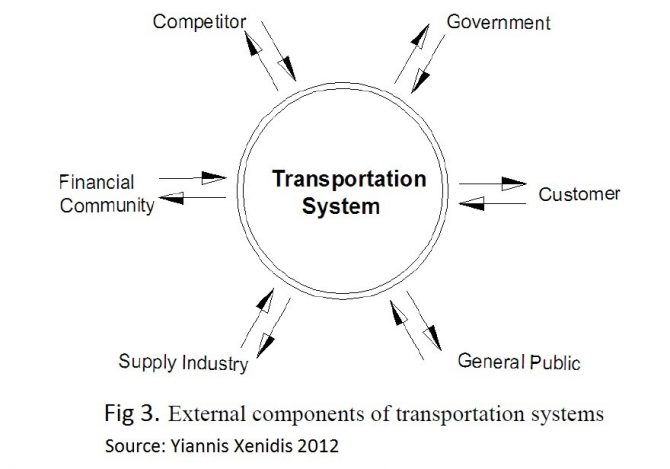
More broadly, it is essential in the development of a resilience strategy for a transportation network, that both its internal (physical) and external components be defined and understood in terms of their potential contribution to a hazard, failure or system disruption, as well as to the protection, mitigation, and recovery solution components from the disruption. Hazards impacting transportation networks can be due to both internal and external component failures/events, natural, life-cycle related, and man-made or intentional. A representation of typical internal and external components of a transportation network is shown in Figures 2 and 3.[6]


Model for Mass Transit Transportation Performance and Resilience Analysis
In our recent work focused on a transit system resilience analysis, an adaptive model was developed to analyze and manage the resilience of a mass transit system such as a light-rail or subway system, with connections to other transit modes or networks such as a bus system.[7] Such a system is vulnerable and subject to both internal and external disruptions.
The model objective is to minimize aggregate travel time (key performance metric) increases due to a local or widespread disruption, while ensuring traveler destination preservation.
Examples of Node disruptions include station shut-downs due to equipment failures, train accidents, and other extreme events, natural and man-made. Link disruptions can be experienced from power system failures, flooding, train collisions, and derailment.
The approach taken to evaluating and mitigating the impact of a disruption on the resiliency of the system is to address and simulate its propagation, i.e. how it might affect the performance for adjacent links, and more broadly aggregate travel time across the overall network.
Mass Transit Transportation Basic Disruption Model
The underlying simulation model generates the flow of passengers across the transit network from a totally or partially disrupted link or node by estimating transfer rates to adjacent links in the same system or connected mass transit mode.
The key underlying variables contributing to the travel time estimation between two nodes, include the travel time spent on a given link, as well as the train dwelling time in station. These times are estimated based on travel volume changes. A simple localized disruption is represented in Figure 4, where a total disruption of link AB and a partial disruption of link BD is envisioned.

The model establishes a simulation-based capability that enables the development of target transfer rates to various links in the network, when one or more links are totally or partially disrupted. The model is based on estimates of the fraction of the passengers who would transfer from a disrupted link to an alternative link to complete their trip, post-disruption. Such a fraction can be defined a priori, based on statistics on passenger destination profiles. By computing the “new” aggregate travel times under various passenger transfer rate scenarios using the technological limitations of train travel and dwelling times under increased traveler volume, an “optimized” target transfer rate for various passenger groups or segments can be established, based on their individual destinations, and relative tolerance for travel time extension versus route complexity.
Such an underlying model can be used as an anchor or foundation for optimizing mass transit resilience under a range of disruption scenarios, ranging from one link total failure, to multiple links total and partial failures:[9]
- One link total: One link is 100% disrupted (line breakage), and no vehicle can travel through that link.
- Multiple link total: Multiple links will be 100% disrupted in a broader maintenance or line failure for several links.
- One link partial: One link is disrupted, partially, and will lead to delays for the vehicle because of the damaged link, due to partial maintenance or effect of weather or natural hazards.
- Multiple link partial: This model indicates that more than one link is being disrupted and will lead to reduced service and delays across many links. Although the partial multiple link disruption can lead to the propagation and amplification of travel delays, it does not lead to a complete shutdown of the links.
- Multiple total / multiple partial: This is the most generalized case where a large disruption takes place due to a large scale event such as a Super storm, where some links are inoperable and others are partially operable due to flooding, etc. Transfers across modes and networks of mass transit would be needed to ensure traveler destination is reached.
Mass Transit Resilience Management: Resourcefulness, Technology and Communications
The model creates an analytical foundation for evaluating the change in performance in a mass transit system in response to a range of short-term and long-term events impacting a sub-network of the transit system. It can be used to optimize resiliency, based on the timing of the start and scope of the failure of every affected link, and the simulation of the traffic flow in neighboring “connected” links.
At the planning stage, resiliency calculations use “deterministic” models based on past traveler behavior or traffic studies. The accurate estimation of the fraction of the traffic flow that would be transferred from the failing link to adjacent and neighboring links across modes can be obtained with further surveys of the traveling population, by identifying their travel behavior, and their preferred back-up routes in the event of small to large disruptions. As a result, the optimization model can be the cornerstone of strategic “resourcefulness” to manage system resiliency, using network improvement and protection measures. This includes hardening key assets, augmenting the back-up capacity of strategic links and routes, and mitigating the impact of disruptions.
In real-time, resiliency can be improved by enabling advanced technological capabilities to be deployed in response to events. Using database and communications technologies, traveler preferences and routes can be established while preserving individual privacy, one traveler at a time, in a manner not unlike the technological under-pinning of the field of micro-marketing.
Using this resiliency optimizer, integrated within a secure connectivity platform, travelers receive notifications to transfer to a preferred route in response to system disruptions and stresses, resulting in a customized trip adviser. Given the intrinsic importance of mass transit systems, and their critical role in a possible population evacuation, the pursuit of this research and development program would yield significant benefits to the nation.
References
[1] Fadi Karaa, L. Potts, J. B. Miima, and B. Data, “Development of a Post-Sandy Community Protection and Resiliency Improvement Program in the Meadowlands,” The Infrastructure Security Partnership (TISP), 2014 Critical Infrastructure Symposium, Colorado Springs, Colorado (2014).
[2] Bob Kolaski, “Partnering for Critical Infrastructure Security and Resilience,” The CIP Report 12, no. 7 (Jan. 2014): 2-4, https://cip.gmu.edu/wp-content/uploads/2013/06/138_The-CIP-Report-January-2014_Resilience.pdf.
[3] Bilal M. Ayyub, “Practical Resilience Metrics for Planning, Design, and Decision Making,” ASCE-ASME Journal of Risk and Uncertainty in Engineering Systems 1, no. 3 (2015), http://ascelibrary.org/doi/pdf/10.1061/AJRUA6.0000826.
[4] Paolo Bocchini, Dan M. Frangopol, Thomas Ummenhofer, and Tim Zinke, “Resilience and Sustainability of Civil Infrastructure: Toward a Unified Approach,” Journal of Infrastructure Systems 20, no. 2 (2014), http://ascelibrary.org/doi/pdf/10.1061/(ASCE)IS.1943-555X.0000177.
[5] Satish V. Ukkusuri and Wilfredo F. Yushimito, “A Methodology to Assess the Criticality of Highway Transportation Networks,” Journal of Transportation Security 2 (June 2009): 29-46, https://www.researchgate.net/publication/227059115_A_methodology_to_assess_the_criticality_of_highway_transportation_networks.
[6] Pavlos Tamvakis and Yiannis Xenidis, “Resilience in Transportation Systems,” Procedia-Social and Behavioral Sciences 48 (2012): 3441-3450, http://ac.els-cdn.com/S1877042812030510/1-s2.0-S1877042812030510-main.pdf?_tid=e4056884-67e2-11e7-b51e-00000aab0f26&acdnat=1499961164_baf3b01db21815619c1d532579239b65.
[7] A. Shabarek, “Mass Transit Transportation Resilience Model under Predictable Hazard Impacts” (MS Thesis, New Jersey Institute of Technology, Apr. 2016)
[8] Ibid.
[9] Ibid.

