
In recent times, resilience has been proposed almost systematically as a response and solution every time a crisis has occurred. However, how can we know whether the solutions adopted to achieve resilience are sufficient? Providing an answer to this question is not possible without finding a way to measure resilience.
Authors in different areas have tried to find a way to represent resilience.[1] Several consider resilience as a function, more or less, of mathematics, which analyses the evolution over time of either performance levels or the quality of the infrastructure operations.
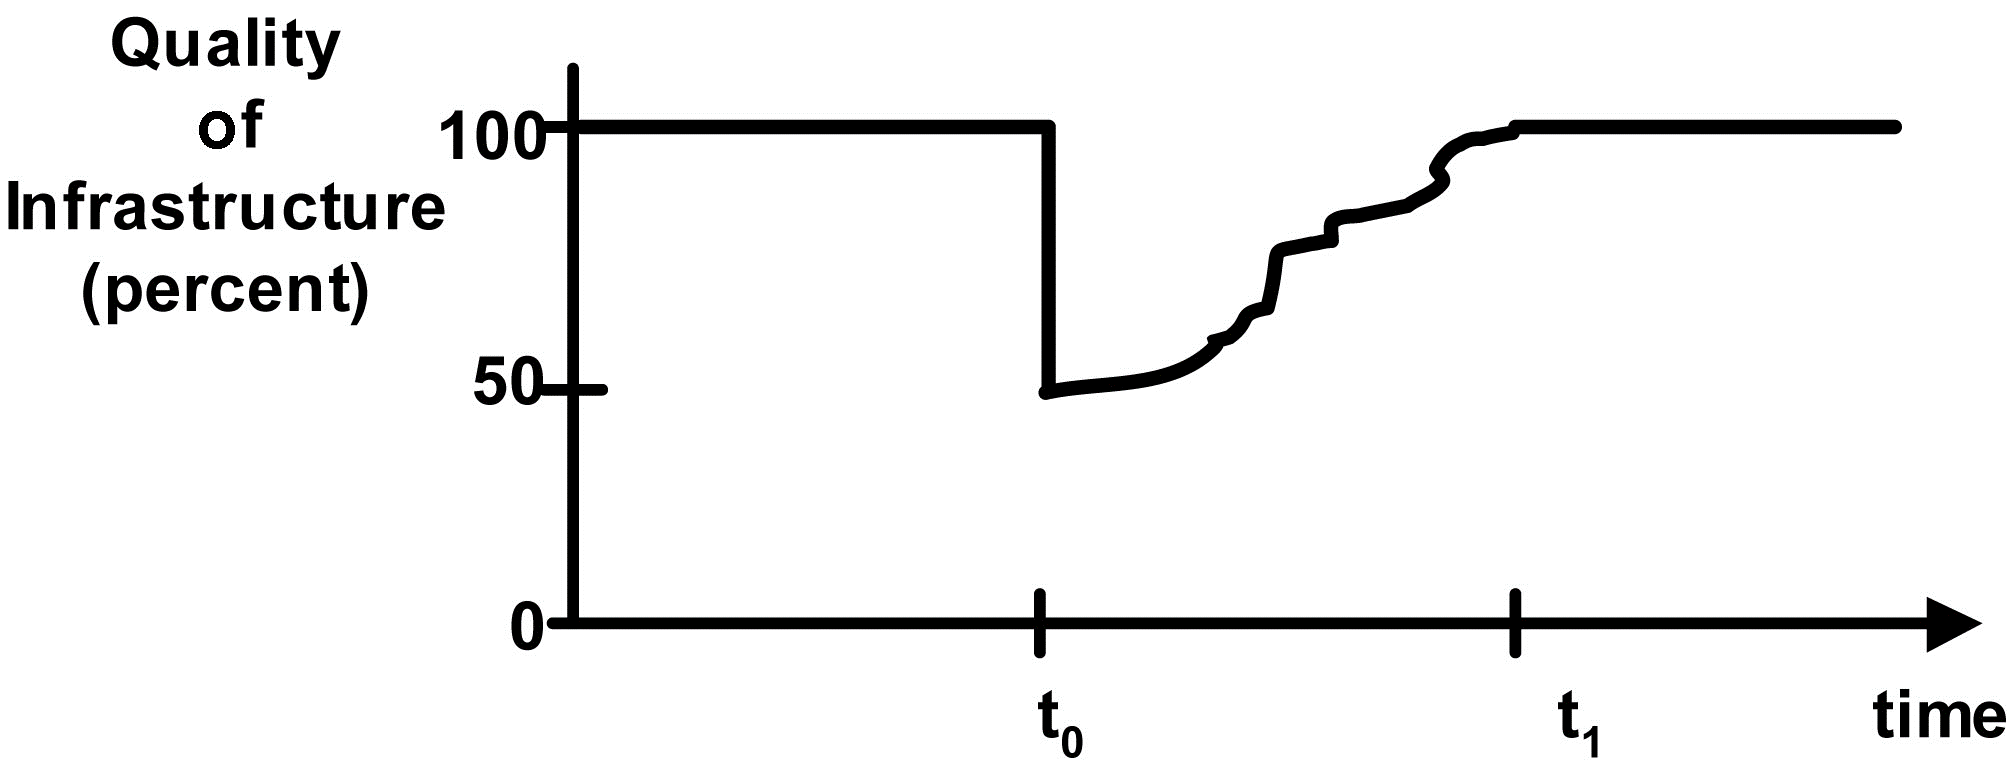
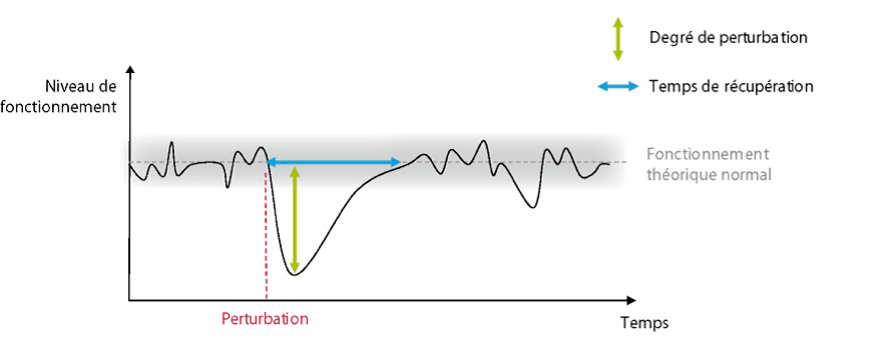
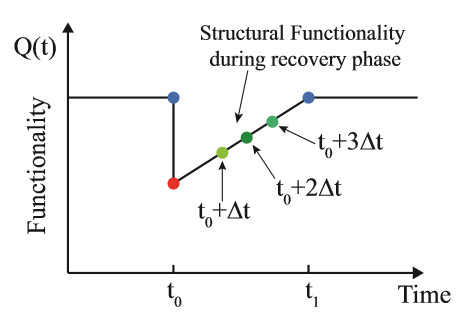
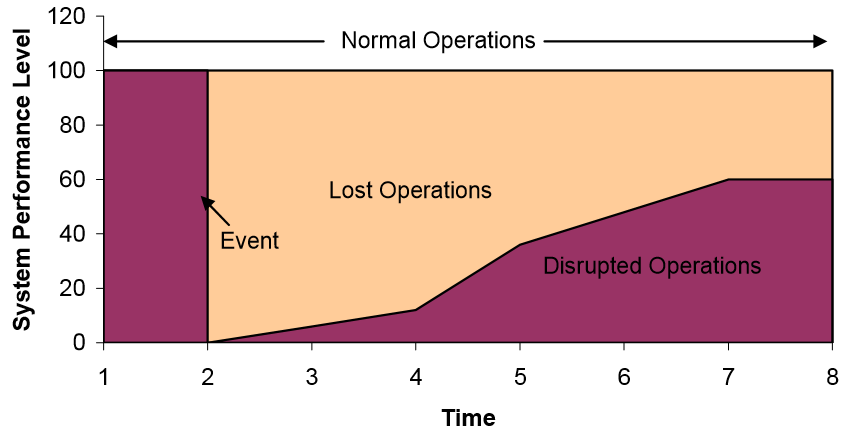
Figure 1 : (a) (Bruneau, et al. 2003) (b) (Toubin, et al. 2012) (c) (Caverzan et Solomos 2014) (d) (Moteff 2012)
Another characteristic of these models and methods is that analysts assume that after a disturbance the infrastructure will return to the same level as before. Unfortunately, this assumption does not take into account the fact that the environment existing after the disruption may have completely changed. They consider resilience as an area affected by the loss of performance and duration in time; the greater the area, the lower the resilience.
An additional point that this approach fails to consider is that the actual performance of the examined infrastructure fluctuates when compared to the theoretical level. Furthermore, it is quite possible that the operating level is greater than or below the theoretical level, but still within the range of tolerance. In these cases, those models and methods can lead to incorrect results, which do not allow a true comparison of infrastructures or a deep analysis.
Finally, taking into account the time and the loss of performance, what those models and methods will measure is the consequences of the disturbance, but only on a theoretical level, since the objective pursued is basically the prevention of the disruption occurrence.
Nevertheless, before one may start measuring resilience, it is necessary to establish what exactly is the objective pursued in examining resiliency. Without seeking to formulate a precise definition, it may be agreed that resiliency covers a certain number of measures aimed at minimising the consequences of a disruption. Therefore, other ways of measuring resilience seem necessary.
However, we should not forgot that, as demonstrated by the Critical Infrastructure Task Force in its report to the Homeland Security Advisory Council, the creation of a resilient critical infrastructure is not a task that can be completed, as it is more of a journey than a destination.[2] Two constraints add to this characteristic of the difficulties faced in measuring resilience: 1. infrastructure requirements evolve over time; and 2. each infrastructure is unique to its environment.[3]
Scientific and technological progress, changing societal needs, climate change, and other factors make the level of performance provided by critical infrastructure vary over time, as well as the infrastructure’s theoretical operating level. Such adjustments made in the day-to-day operations of infrastructure produce fluctuations that have a low impact on the services the infrastructure provides.
In Figure 2, different levels of performance represent these fluctuations of the level of performance. The Theoretical operating level is portrayed in black, and the Current operating level is portrayed in blue. A third level, known as the Unacceptable level, is represented below the theoretical level in red. This level identifies the point where performance of the infrastructure is under the expected service level.
Operating modes that are located in the space between the theoretical level and the unacceptable level will be those typically considered as degraded modes of operation; this space is the tolerance zone or tolerance. However, these two levels must be established jointly between all stakeholders (i.e. authorities, operators, owners, end-users, etc.), and should also be regularly reviewed to ensure that each party’s expectations have not changed. Since these expectations may evolve at different speeds, both levels may not always be parallel (Figure 3: Different levels of tolerance)

Figure 2: Different levels of performance
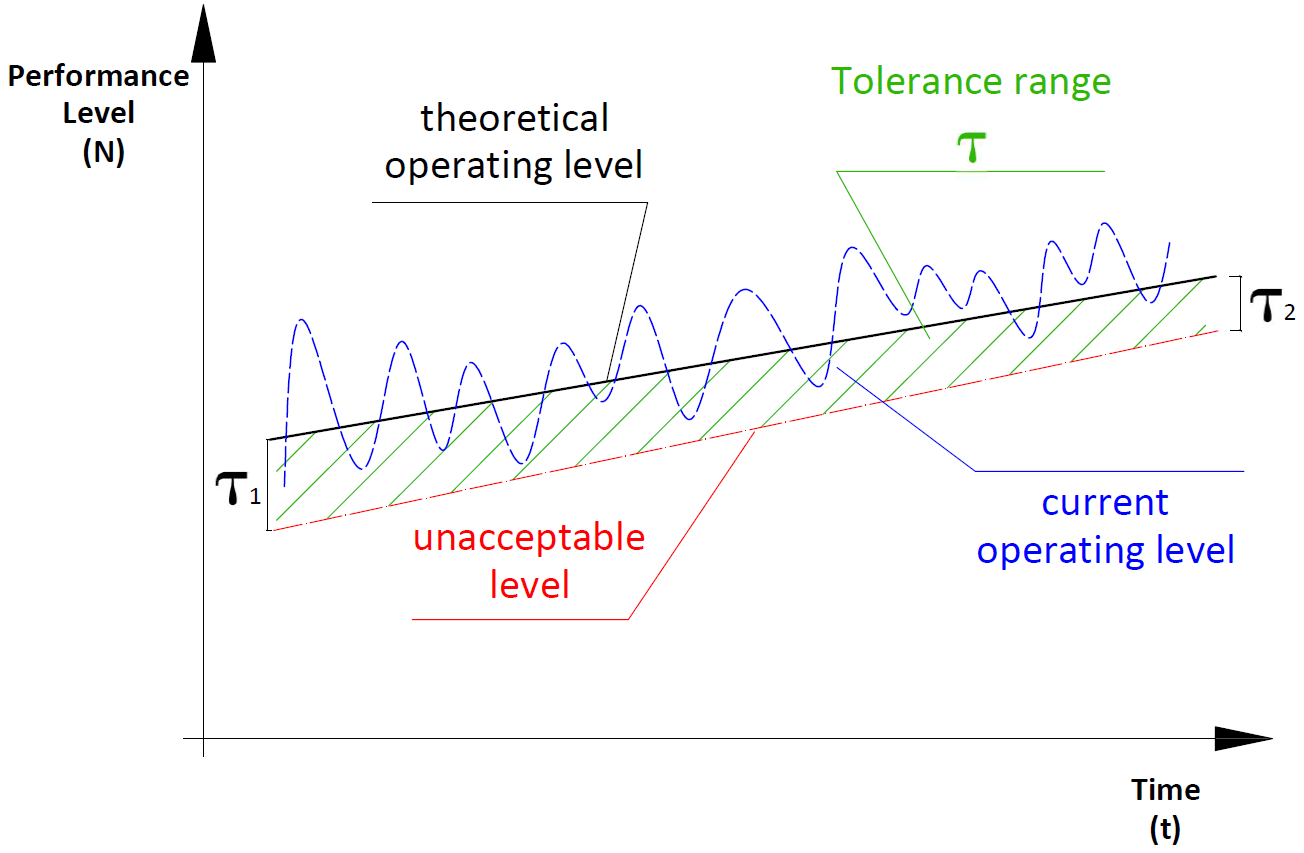
Figure 3: Different levels of tolerance
It is worth mentioning that for these evolutions in infrastructure performance levels, each infrastructure is located in a particular geographical location, with a unique environment and exchange of staff in their operation and maintenance. These factors have a crucial impact in the analysis of each component, as well as the general operation of the infrastructure. These differences were identified by the inspectors of the DHS’s choice of the assets participating in the Regional Resiliency Assessment Program.[4]
This individualisation imposes a measure that can take account of each infrastructure for a single form in relation to its surroundings, but by providing an outcome, which allows a comparison with other infrastructure.
This comparison would be possible through the establishment of a Resilience Index . This index would on the one hand be an element of comparison between two different infrastructures, and on the other hand have a clear objective to achieve. This objective would be the perfect resilience. Perfect resilience means that although the infrastructure might suffer disruptions, its adverse consequences are thwarted before users perceive any loss of performance.
The constant change of environment and the continuing adjustment in infrastructure management makes these events affect infrastructure at different levels and in various ways. These events are, most of the time, countered by protection measures adopted in advance. Unfortunately, in some cases, these measures are not sufficient and disturbances occur that cause problems.
The first consequence will be the exceedance of the unacceptable level, which corresponds mostly to crises. This interval is the period of disturbance, which is comprised of a Stall phase followed by a Recovery phase (Figure 4 : Consequences of a disruption in the day-to-day operation of an infrastructure).
The Stall phase will occur suddenly and will follow an event whose consequences go beyond the existing contingency measures. This overrun will lead to the loss of control of the situation. During this phase, there is a Stall (D) of the infrastructure’s performance. The duration of this phase will be more or less long but only has two possible outcomes: 1. the infrastructure enters in the Recovery phase; or 2. infrastructure is lost definitively.
The Recovery phase is characterised by gradually increasing the performance of the infrastructure until it returns to the theoretical operating level. During this phase the infrastructure is not yet stable, and events that in normal circumstances would not cause an impact may become disturbances that have the capacity to collapse the infrastructure.

Figure 4 : Consequences of a disruption in the day-to-day operation of an infrastructure
Figure 5 offers a comparison of the reactions of infrastructure index resilience, and shows how the level of resilience acts on the consequences of a disruption. The blue line represents the day-to-day operating level of an infrastructure (Infi) with a Resilience Index at one determinate moment. That infrastructure is subject to a Disturbance (DA). The green line will represent the behaviour of the same infrastructure following the same disruption (DA) when is a higher Resilience Index than . This higher Resilience Index will allow a lower Stall phase and a shorter period of disturbance.
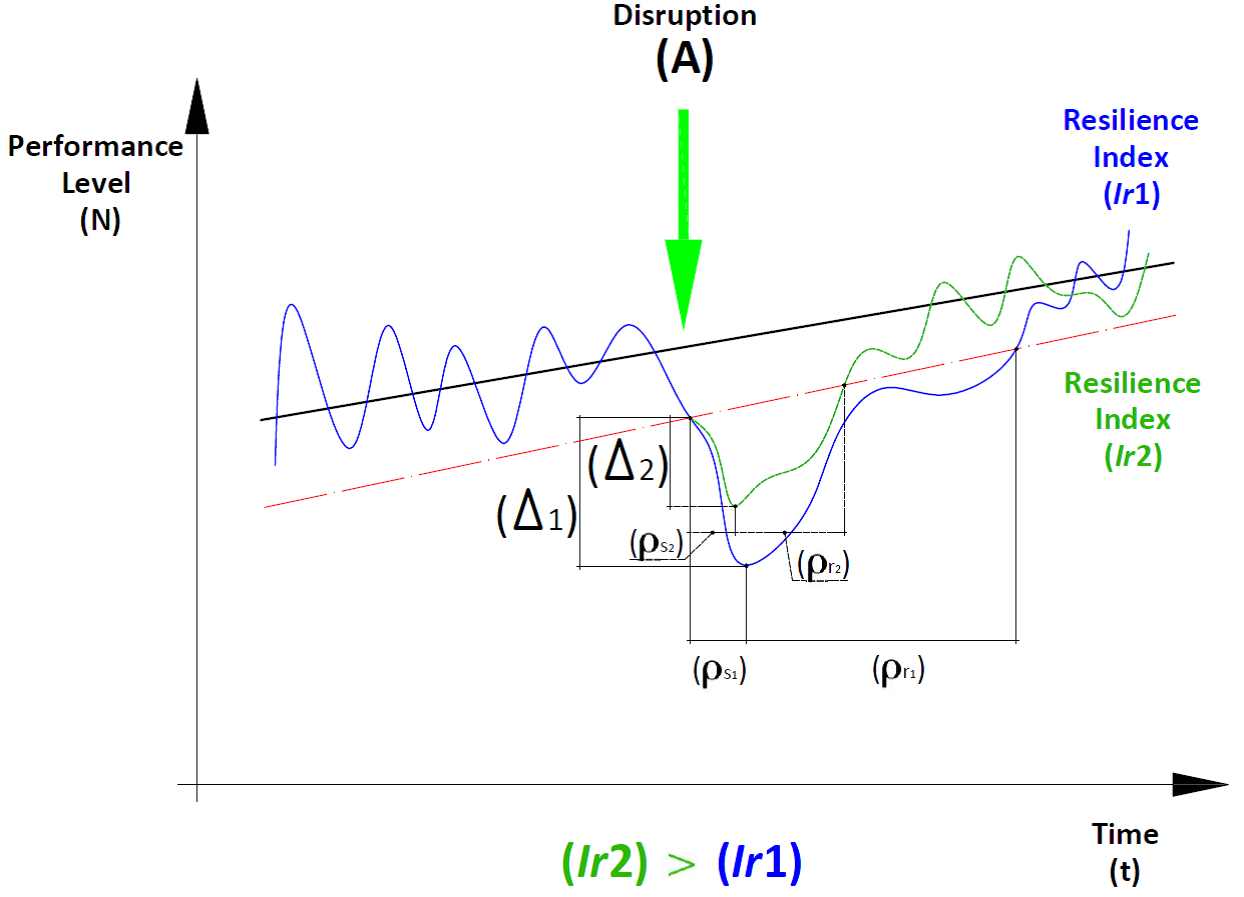
Figure 5 : Comparison of the reactions of infrastructure index resilience
A further advantage of the Resilience Index is that it allows one to have an overview of the level of resilience at any time, which facilitates the detection of points where changes are necessary and comparing infrastructure, with different locations and in different environments.
Figure 6 analyses performance levels as a function of time by representing the theoretical operation of three levels of infrastructure work in parallel. However, their expected levels of performance vary over time due to environmental changes. Taking infrastructure Inf C (orange line), it is possible to assess the variance in performance level anticipated at expected (t1) (t2) and (t3). If the existing resilience index (t1) does not change, it is highly likely that the infrastructure is not able to cope with a disruption occurring at (t2). Similarly, maintaining the same resilience index (t1) when the infrastructure is located in the vicinity of (t3) would be a waste of resources.
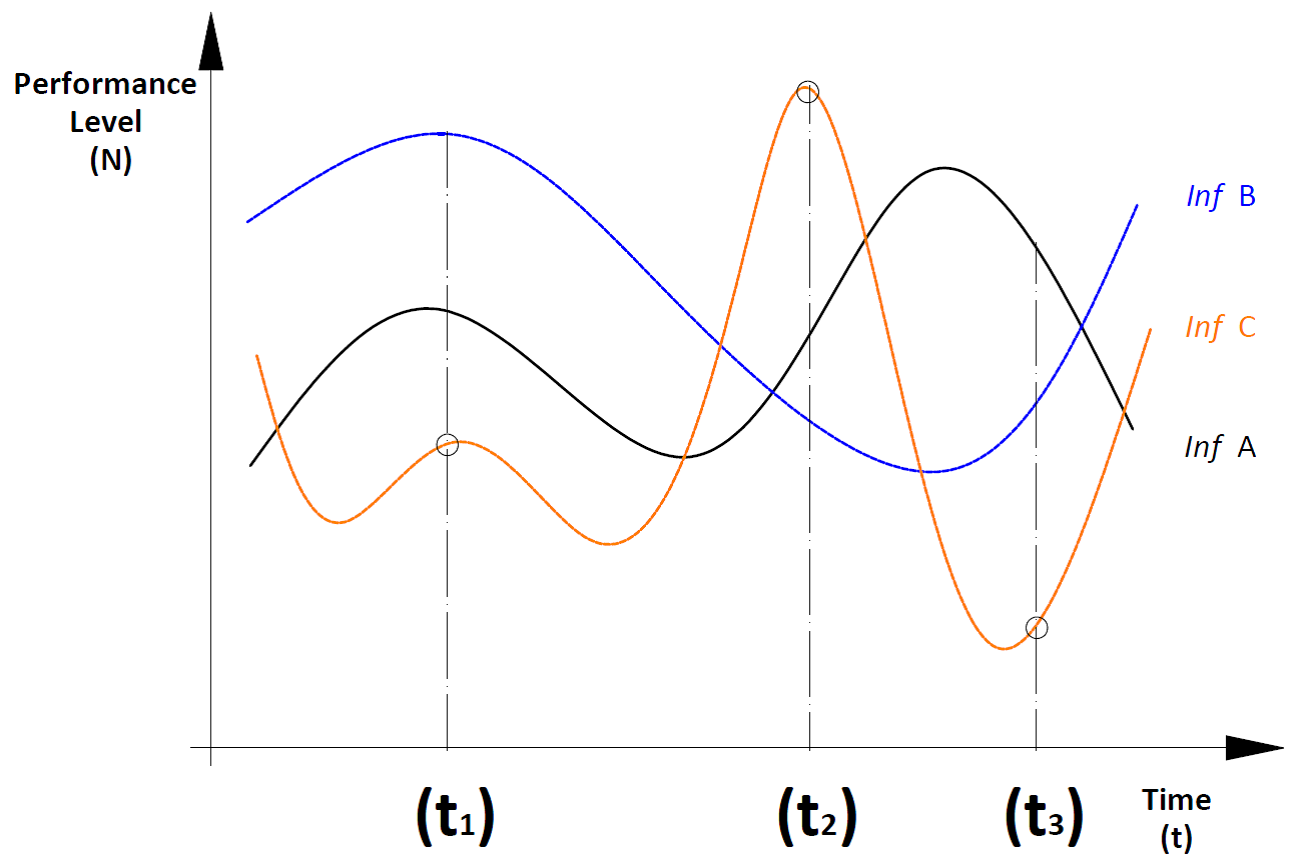
Figure 6 : Performance levels as a function of time
This example also shows the importance of a Resilience Index adapted to infrastructure. Consider three identical infrastructures with the same facilities and similar means, but their way of functioning is adapted to Inf A. If these infrastructures suffer the same disturbance at (t1), Inf A will be able to recover from the disturbance, Inf C is highly likely to be destroyed, and Inf B would not even have suffered a disturbance but absorbed costs disproportionate to the expected level of performance.
Before we start to examine how to minimise the consequences, it should be recalled that it is normal for the arrival of the disturbance to be unexpected. This is because the unexpected consequences are the main component of a disturbance. However, the consequences of the disturbance’s arrival should not come as a surprise.[5] Once the impact is identified, building resilience will facilitate a rapid return to the theoretical operating level and reduce the onset of an early Stall phase.
This change in focus from the disturbance itself to the consequences of the disruption will facilitate the adoption of holistic approaches to resiliency. This systemic approach will be a facilitator in the recovery of infrastructure, as this will allow the inclusion of unconventional solutions that could be adapted to a particular disturbance.
This holistic approach will allow practitioners to simultaneously work on the potential causes of the disturbance, one of which may be the cause of the disruption, while accepting that disturbances can occur in spite of preventative measures. Moreover, since the consequences of the disruption were envisaged, other measures may be foreseen. This holistic approach will lead to a reduction in the length of a disturbance and the scope of its consequences, which is the final goal of infrastructure resilience.
Francisco José Miranda Perales works in the Maintenance Unit at the European Parliament in Strasbourg (France) and is an Arquitecto Técnico (Universidad de Burgos) with a degree in Management of Building Facilities (UNED). Francisco is currently completing a Master’s in Risk Management at UHA (Mulhouse, France) & ENSOSP (Aix en Provence, France).
References
[1] See Michel Bruneau, et al., “A Framework to Quantitatively Assess and Enhance the Seismic Resilience of Communities,” Earthquake Spectra 19, no. 4,(2003): 733-52, http://earthquakespectra.org/doi/pdf/10.1193/1.1623497; John D. Moteff, Cong. Research Serv., R42683 Critical Infrastructure Resilience: The Evolution of Policy and Programs and Issues for Congress (2012), https://www.fas.org/sgp/crs/homesec/R42683.pdf; Marie Toubin, et al., “La Resilience Urbaine: Un Nouveau Concept Opérationnel Vecteur de Durabilité Urbaine?,” Developpenment Durable et Territoires 3, no. 1 (May 2012): 15, https://developpementdurable.revues.org/9208?lang=en; Alessio Calverzan & George Solomos, European Commission, Review on Resilience in Literature and Standards for Critical Built-Infrastructure, EUR 27065 EN (June 2014), http://publications.jrc.ec.europa.eu/repository/bitstream/JRC90900/resilience_report.pdf (internal report).
[2] Homeland Security Advisory Council, Report of the Critical Infrastructure Task Force (Jan. 2006), https://www.dhs.gov/xlibrary/assets/HSAC_CITF_Report_v2.pdf.
[3] Environment should be considered in accordance with: Steven M. Rinaldi, James P. Peerenboom, & Terrence K. Kelly, ”Identifying, Understanding, and Analyzing Critical Infrastructure Interdependencies,” IEEE Control Systems Magazine 21, no. 6: 11-25 ( Dec. 2001), http://www.ce.cmu.edu/~hsm/im2004/readings/CII-Rinaldi.pdf.
[4] John F. Mortin, “GAO Report Calls for the Department of Homeland Security (DHS) to Strengthen the Management of its Regional Resiliency Assessment Program,” Center for Infrastructure Protection and Homeland Security 12, no. 7: 13-16 (Jan. 2014), https://cip.gmu.edu/wp-content/uploads/2013/06/138_The-CIP-Report-January-2014_Resilience.pdf.
[5] Lance Gunderson, Comparing Ecological and Human Community Resilience: CARRI Research Report 5. (Oak Ridge: Community & Regional Resilience Initiative, Jan. 2009), 35, http://www.resilientus.org/wp-content/uploads/2013/03/Final_Gunderson_1-12-09_1231774754.pdf